Breakdown 2 of 4
Optimisation pass
I ran Project UMBRAE's optimisation, including a community profiling event with the game as the case study, and found its biggest single gain in a render target.
Overview
I was in charge of optimisation on Project UMBRAE. Some of it was planned from pre-production, mainly the level streaming, and the rest came from profiling once the house was dressed and lit.
Going in, my research was Reuter’s guide to profiling as a tech artist (Reuter, 2025), Oztalay’s talk on UE5 rendering performance (Oztalay, 2024), and Cavanagh and Michaelides on automating performance capture (Cavanagh and Michaelides, 2025). From those, the plan was to produce data that could be compared across the whole project and review it every week, to catch bottlenecks while they were still forming.
In the end, the biggest single gain came from a gameplay system, the render target behind item inspection, not from an engine setting (SimonDev, 2024).
A bottleneck in one classroom
In Week 2 of pre-production, the project started dropping frames badly in one classroom, with the GPU showing high usage. An empty test level, just a grid floor and one cube, was running at under 11 FPS.
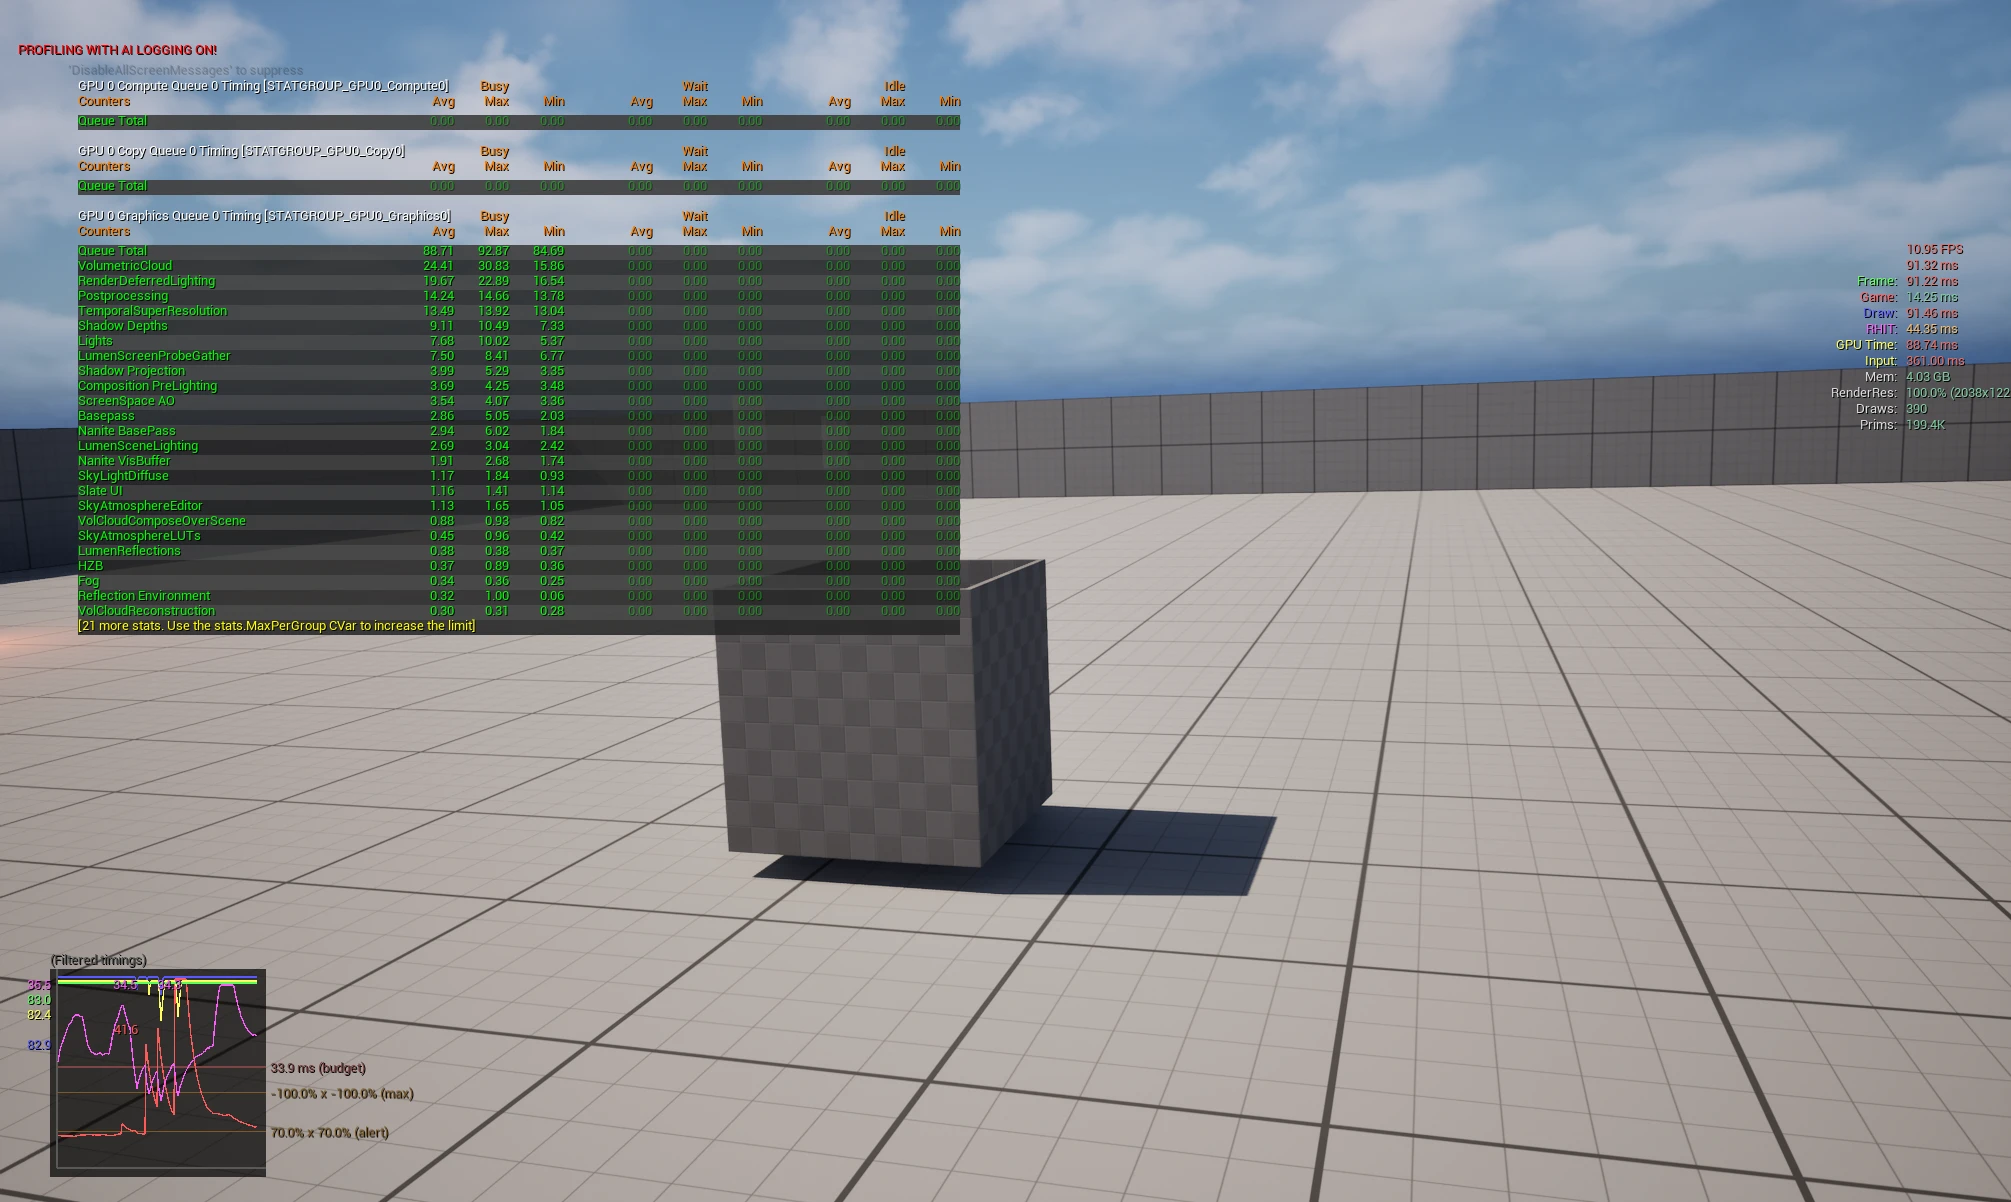
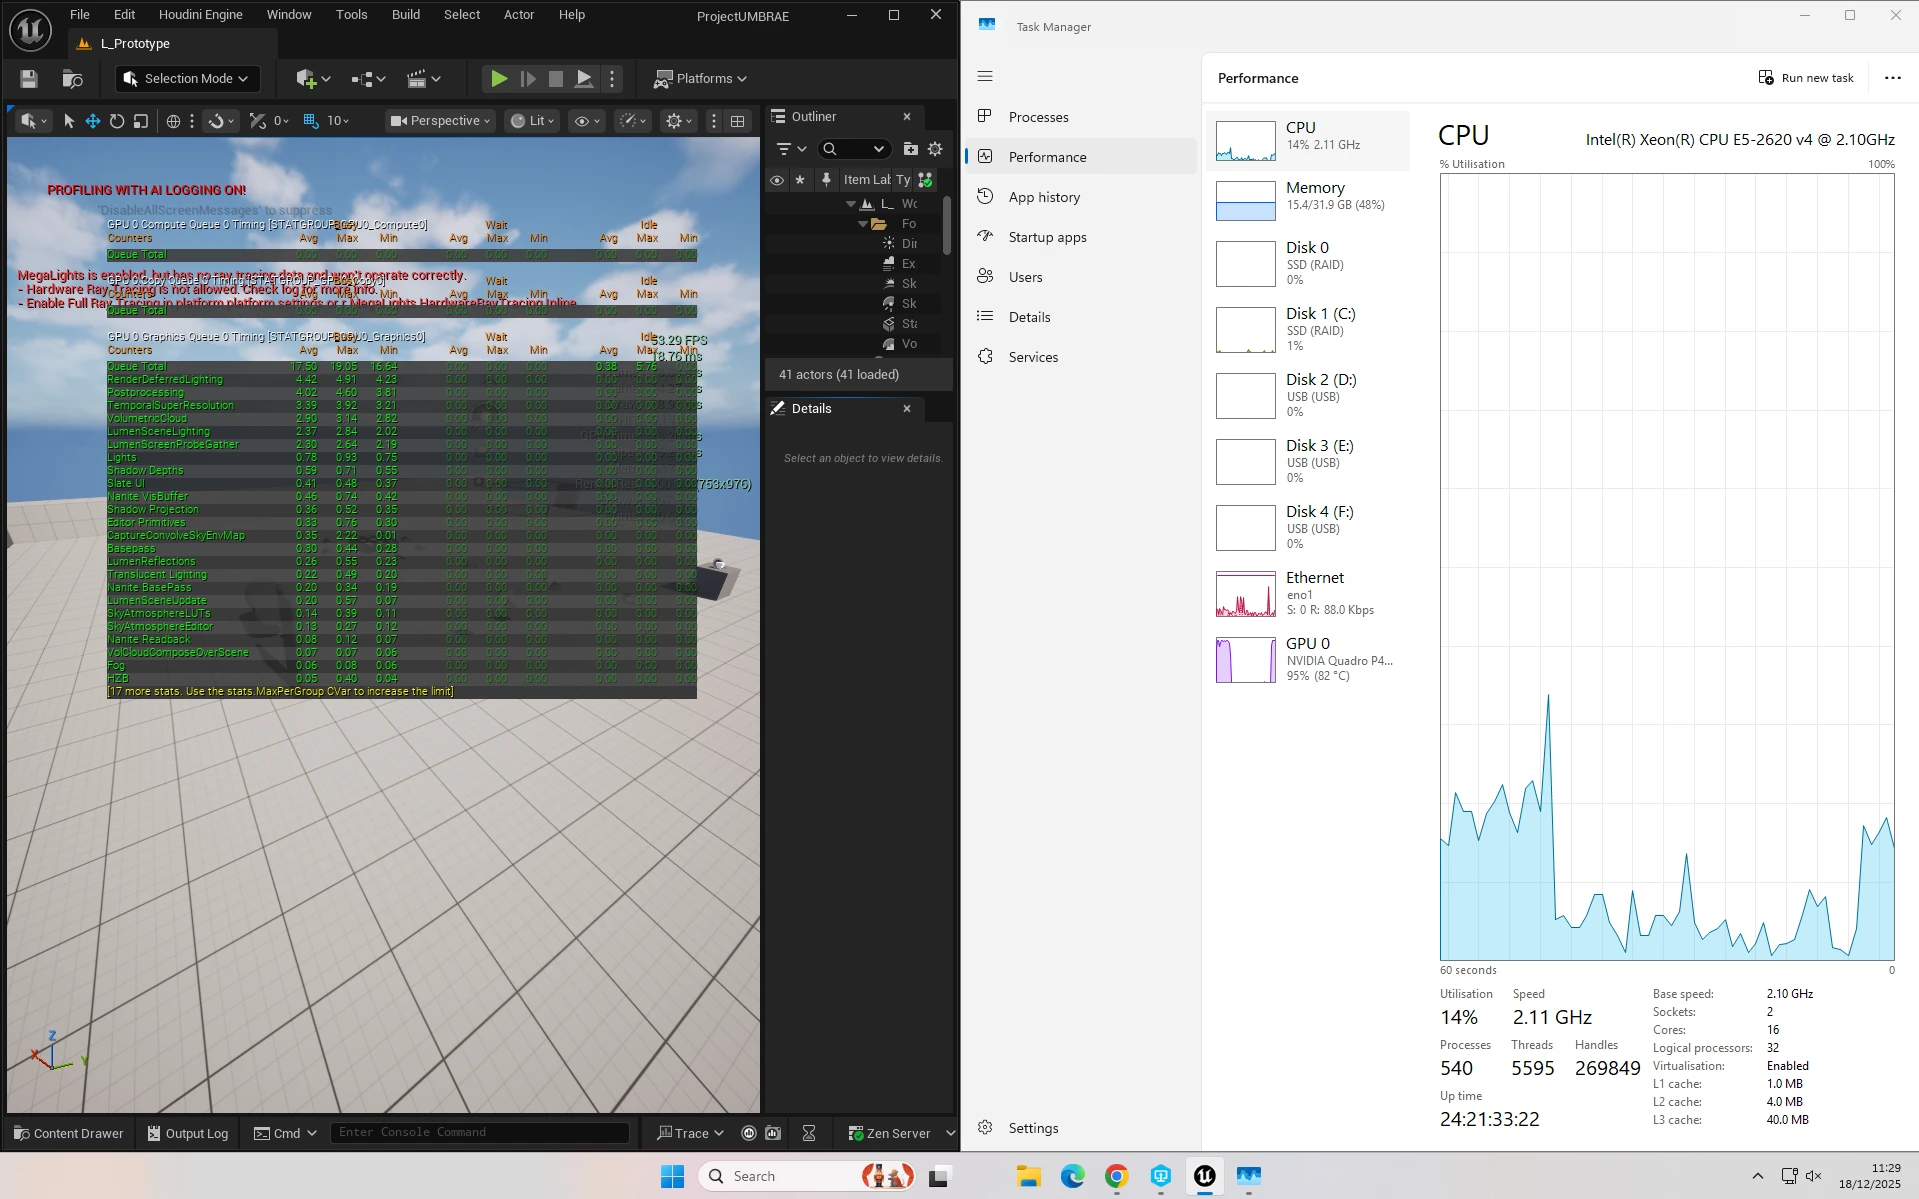
My read at the time was that the PCs in that room are built for multi-threaded work, but the editor relies on a single thread to dispatch rendering. That thread was holding up the whole GPU pipeline and making the GPU look far busier than it really was. Most of what I knew about telling CPU and GPU bottlenecks apart came from Ben Cloward’s series (Cloward, 2025). When Gregor asked for data, I tested the same project in that room, in another classroom and at home.
The whole house ran faster on the other machines than a near-empty level did in Winterfell. The PCs in that room also had no hardware ray tracing, which was a problem because Matty wanted to use MegaLights (Epic Games, n.d.d) for the lighting.
Level streaming
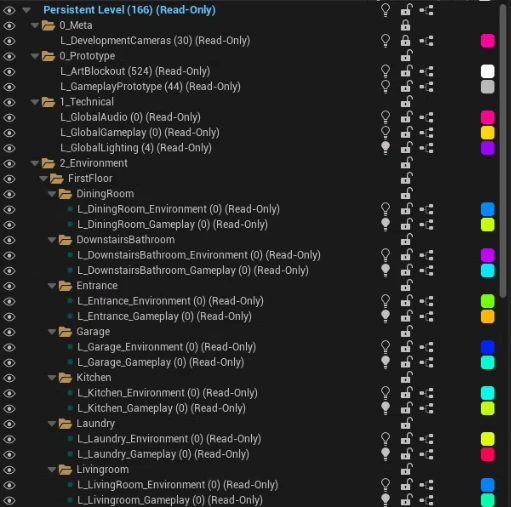
I set up room-by-room level streaming over the Christmas holiday, while nothing depended on it yet. Every room has two sublevels: Gameplay for anything dynamic or interactable, and Environment for anything static.
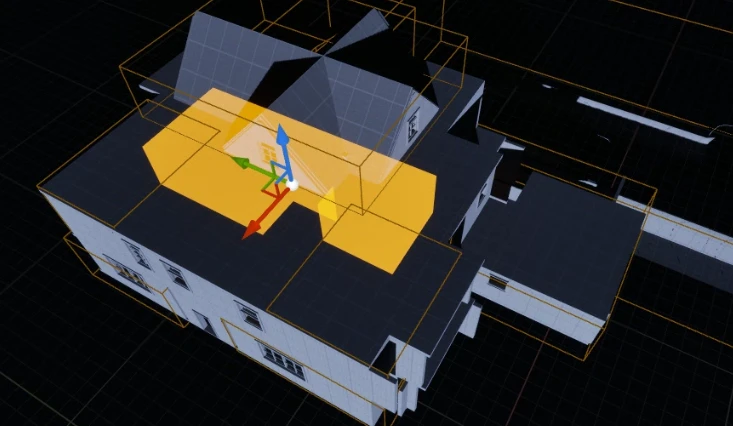
Each room then got a Level Streaming Volume (Epic Games, n.d.a) for its two sublevels. A volume can load any room that’s visible from inside it, so a floor the player can’t see is never even considered for culling.
It paid off later in three ways:
- Culling could be aggressive once the house filled up with props.
- The lighting team could work on one room without recooking the whole house.
- The progress log captures could control which rooms were visible, through the Cinematic Level Visibility Track (Epic Games, n.d.b).
The first is the optimisation, and the other two are why it was worth setting up so early.
The item inspect render target
Item inspection, which Joel built, shows the item you’ve picked up through a render target. Every inspectable item in the level was writing to that render target every frame, whether or not anything was being inspected.
While getting the build ready for Jan’s community, I reworked it:
- Lower resolution on the render target, and a cheaper format.
- Orthographic capture.
- Its own light channel, lit only locally with a rim light.
- Only captures when needed, for the item actually being inspected and only when its mesh moves.
I also removed old construction script captures that were still running on item blueprints that weren’t inspectable at all. Together, it was the biggest single performance gain of the project.
Profiling with Jan’s community
Outside uni, I’m part of an optimisation community run by Jan Mróz, a graphics programmer at The Knights of U (Mróz, 2026), with regular calls on optimisation and profiling. When I brought up Project UMBRAE on one of the calls, people wanted to try it, so Jan and I set it up as a community optimisation challenge with the game as the case study. Members could play the shipping build, and open the editor project to take Unreal Insights and GPU captures.
For the event I built a performance free-cam mode, so everyone could capture the same views and compare them across machines. After Jan’s feedback I added a locked-off camera view and made the flashlight and the player toggleable, to isolate variables. Everyone also launched the game with the same script.
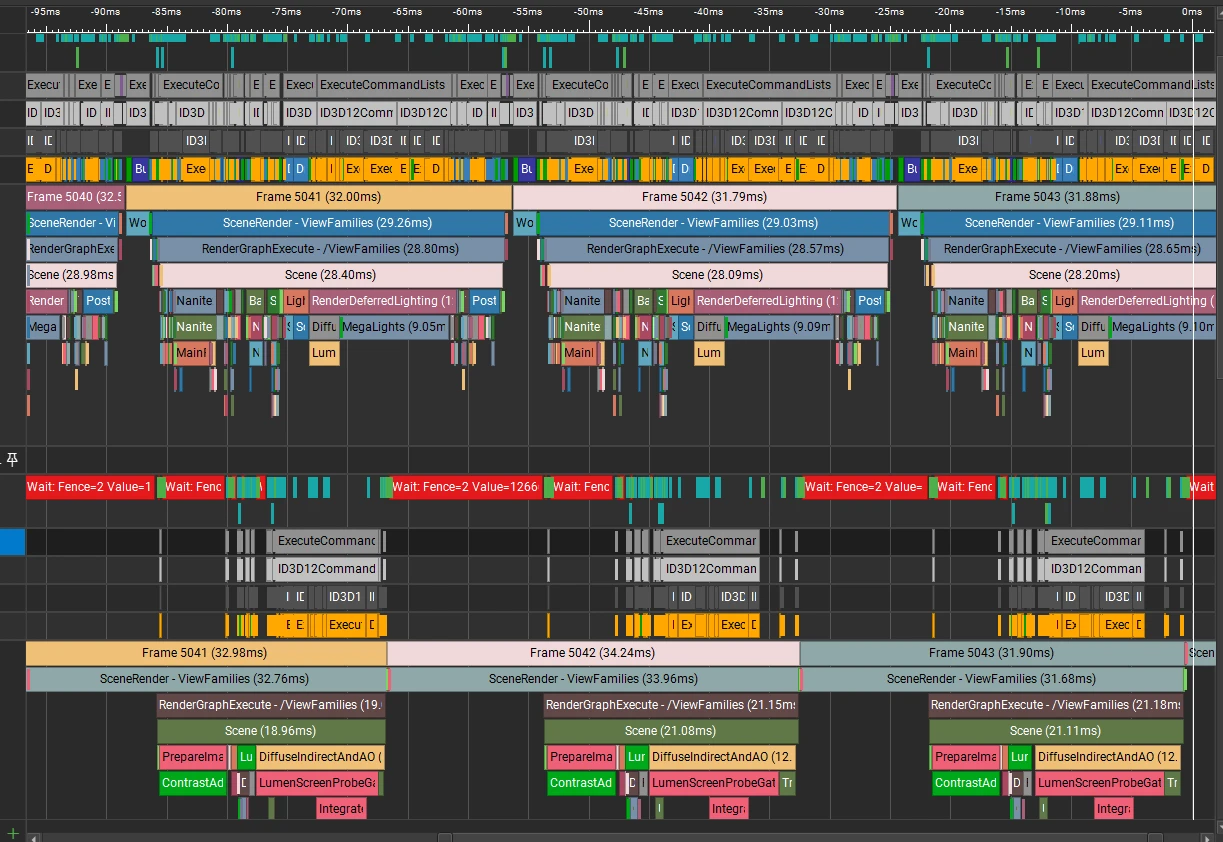
Jan’s view was that lighting had become the bottleneck. He suggested disabling Nanite, culling lights harder, using non-shadow-casting lights wherever possible and, ideally, baking the lighting. His estimate was that doing all of it would take the frame from 24ms down to 8ms.
The performance pass
Using the community’s feedback and my own profiling, I did a performance pass in the week of Karl’s second showcase. These are the timings I noted down for each change:
- Lights - any light further than 1000 units from the view is disabled.
- Nanite - disabled. The mesh budget on this project didn’t justify the overhead it added (Epic Games, n.d.e).
- Hair - swapped from strands to cards with a lower simulation quality, and the cinematic hair only switches on inside cutscenes.
- Volumetric fog - limited to 1000 units at half quality, and the flashlight no longer affects it, which also got rid of a lot of trailing light.
Turning Nanite on everywhere was originally my decision. The asset guide I wrote in pre-production says every mesh must be Nanite-enabled, and one of the default rules in Escape Asset Helper turns Nanite on for every static mesh. Profiling the finished house showed that was the wrong call for this project.
Later I also capped every texture at 2K except walls, floors and large fixtures, which freed up VRAM with no visible loss at gameplay distances.
Lighting and reflections
Lumen (Epic Games, n.d.c) needed a lot of work in a house with thin interior walls. Light leaked through them even after Charlotte extended them out, and the fix I ended up with was crude: large masked boxes at zero opacity wrapped around the whole exterior, which stop Lumen placing probes outside. Most of the other approaches I tried didn’t work.
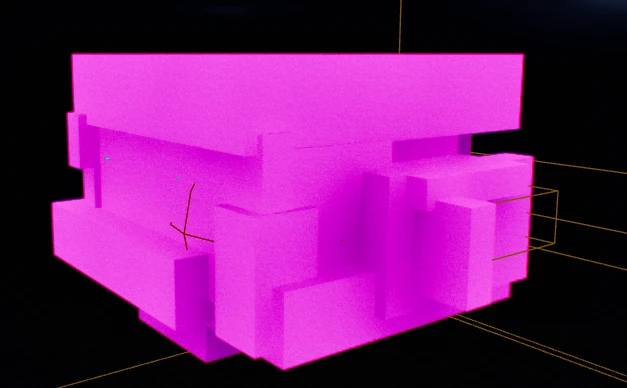
Shadow blockers sit inside the walls and floors, so when a room’s levels unload, the rooms around it don’t light up strangely from the missing geometry. Mirrors use planar reflections plus screen space reflections, which I chose after comparing the options for the portal decision.
Problems and fixes
- Falling through unloaded rooms - The first Level Streaming Volumes used complex collision shapes, and the player could drop through a room that hadn’t loaded yet. I switched every volume to simple shapes, made them bigger so they overlap, and split some rooms into smaller volumes to cut the loading cost.
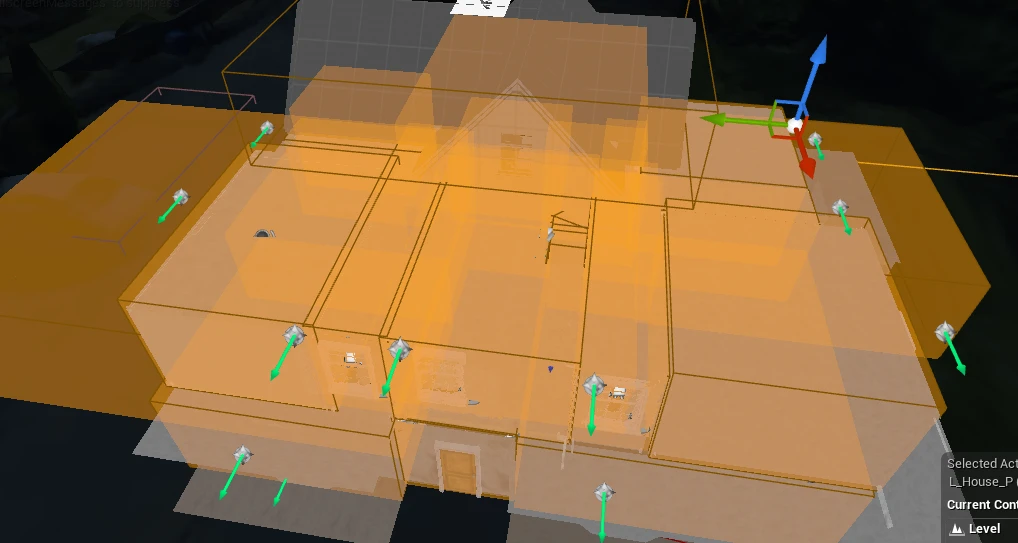
- Gameplay resetting on load - Gameplay actors were reinitialised every time their level loaded, which broke their state. I made the gameplay levels always loaded and culled the actors inside them by distance instead. Pickups also fell through floors that had unloaded underneath them, so I turned off their gravity. My notes mark both as needing a proper fix.
- Inspection breaking after the rework - First the scale came through as zero, which Joel and I fixed. Then inspected items showed up tiny and out of perspective, because they weren’t actually being scaled for inspection.
- Reflections - A light with a soft radius of 0 rendered a white sphere that only showed up in reflections, and in the bathroom and nursery mirrors, small or complex props rendered black until they were given simpler shader models.
Reflections
My plan at the start was comparable data, reviewed every week. But the tools that actually made the data comparable, the free-cam and the launch script, only arrived late in production, because Jan’s community needed them. If I’d had them from pre-production, the render target cost would have shown up in a trace much earlier.
Sources
Cavanagh, S. and Michaelides, M. (2025). Integrated Insights: Automating Performance Capture in Unreal Projects. Unreal Fest Orlando 2025.
Why performance data should be comparable across the whole project.
Cloward, B. (2025). Game Optimization - Introduction & General Principles - Episode 1. [online] YouTube. Available at: https://www.youtube.com/watch?v=jt8b0cpjUVk [Accessed 20 May 2026].
Where most of what I knew about CPU and GPU bottlenecks came from, before the classroom problem.
Epic Games (n.d.a). Level Streaming Volumes Reference in Unreal Engine. [online] Epic Developer Community. Available at: https://dev.epicgames.com/documentation/en-us/unreal-engine/level-streaming-volumes-reference-in-unreal-engine [Accessed 20 May 2026].
Epic Games (n.d.b). Cinematic Level Visibility Track in Unreal Engine. [online] Epic Developer Community. Available at: https://dev.epicgames.com/documentation/en-us/unreal-engine/cinematic-level-visibility-track-in-unreal-engine [Accessed 20 May 2026].
Epic Games (n.d.c). Lumen Global Illumination and Reflections in Unreal Engine. [online] Epic Developer Community. Available at: https://dev.epicgames.com/documentation/en-us/unreal-engine/lumen-global-illumination-and-reflections-in-unreal-engine [Accessed 20 May 2026].
Epic Games (n.d.d). MegaLights in Unreal Engine. [online] Epic Developer Community. Available at: https://dev.epicgames.com/documentation/en-us/unreal-engine/megalights-in-unreal-engine [Accessed 20 May 2026].
Epic Games (n.d.e). Nanite Virtualized Geometry in Unreal Engine. [online] Epic Developer Community. Available at: https://dev.epicgames.com/documentation/en-us/unreal-engine/nanite-virtualized-geometry-in-unreal-engine [Accessed 20 May 2026].
Mróz, J. (2026). GPU Optimization for Unity. [online] Skool. Available at: https://www.skool.com/gpu-optimization-for-unity [Accessed 22 May 2026].
Jan's optimisation community, which ran the Project UMBRAE profiling event.
Oztalay, M. (2024). Optimizing UE5: Advanced Rendering, Graphics Performance, and Memory Management | Unreal Fest 2024. [online] YouTube. Available at: https://www.youtube.com/watch?v=dj4kNnj4FAQ [Accessed 20 May 2026].
Pre-production research.
Reuter, A. (2025). Technical Artist's Guide to Profiling in Unreal Engine | Unreal Fest Orlando 2025. [online] YouTube. Available at: https://www.youtube.com/watch?v=mCZRHljYnZA [Accessed 20 May 2026].
Pre-production research on how to profile and what to look at.
SimonDev (2024). Most Optimization Advice Misses the REAL Problem. [online] YouTube. Available at: https://www.youtube.com/watch?v=phbaxNPJxss [Accessed 20 May 2026].
The argument that the real cost is rarely where the usual advice points.